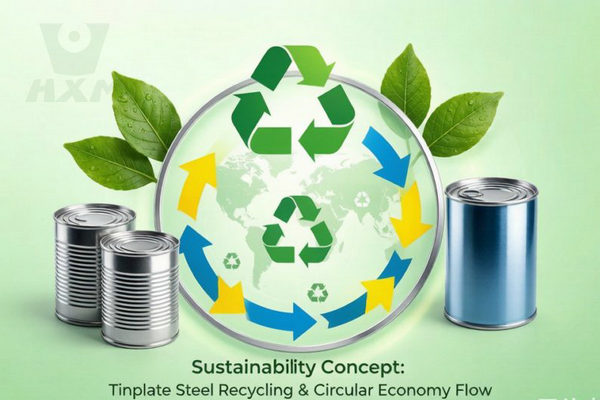
Quick Answer: Is Tinplate Sustainable?
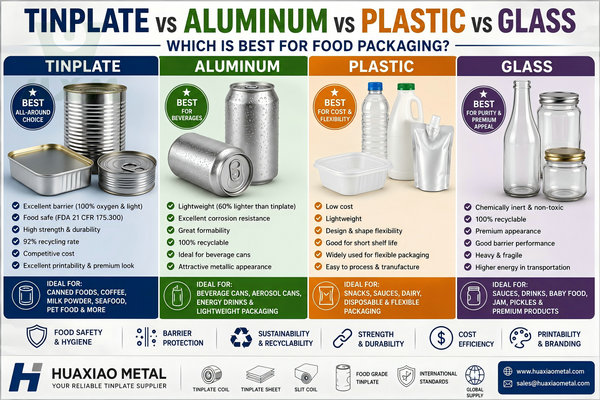
Yes, tinplate is one of the most sustainable food packaging materials available. It achieves a 92% global recycling rate — the highest of any packaging material — and is classified as Grade A recyclable (>95%) under the EU’s 2026 Packaging and Packaging Waste Regulation (PPWR). Steel’s magnetic property enables energy-efficient, high-purity sorting (98%+) from mixed waste, and recycled steel requires only ~30% of the energy needed for primary production. Tinplate contains no PFAS, no BPA in modern lacquer systems, no microplastics, and is a mono-material (steel) that simplifies recycling streams. When evaluated against aluminum, plastic, and glass across full lifecycle carbon footprint, recyclability, and material health criteria, tinplate consistently performs in the top tier for sustainability.
5-Dimension Sustainability Overview for Tinplate Packaging
Tinplate’s sustainability performance is best understood across five interconnected dimensions that together create a comprehensive environmental profile:
| Sustainability Dimension | Tinplate Performance (2026 Data) | Industry Significance |
|---|---|---|
| 1. Recycling Rate & Circularity | 92% global recycling rate; 82.5% EU (APEAL 2024); 70% US (SRI 2025); infinite recyclability without quality loss; magnetic separation enables automated, energy-efficient recovery (>98% purity) | Meets PPWR Article 6 requirements for Grade A recyclability (>95% of material recyclable at scale). The magnetic property is a permanent physical characteristic that works regardless of waste management infrastructure maturity. |
| 2. Carbon Footprint (LCA) | 850–1,100 kg CO₂e/ton net (with 92% recycling credit); 400–600 kg CO₂e/ton (100% recycled scenario); ~70% energy savings from recycling vs primary production; blast furnace → EAF transition reducing primary footprint 40–60% | Steel industry committed to 50% CO₂ reduction by 2030 vs 2018 baseline (World Steel Association). Hydrogen-based DRI (direct reduced iron) technology projected to reduce primary steel CO₂ by 80–95% by 2040. |
| 3. Material Health (Chemical Safety) | PFAS-free — no perfluorinated compounds in passivation or lacquer; BPA-free lacquer systems available as standard (polyester, acrylic, oleoresinous); no microplastics released; no PVC; Cr³⁺ passivation (Cr⁶⁺ prohibited); FDA 21 CFR 175.300 food contact compliance | PPWR Article 5 restricts PFAS in food contact packaging from 2026. Tinplate is inherently PFAS-free, unlike some plastic coatings and paper packaging treatments. BPA-free is standard, avoiding endocrine disruption concerns associated with epoxy can linings. |
| 4. Resource Efficiency | 92% recycled content in new steel; 607 kg of steel scrap recycled every second globally; 1.6 tons of iron ore saved per ton of recycled steel; 0.6 tons of coal saved per ton of recycled steel; 70% water savings vs primary production | EAF (Electric Arc Furnace) steelmaking using scrap — 70% of US steel and 45% of EU steel uses this route. The high recycled content percentage means most tinplate packaging already contains post-consumer recycled material. |
| 5. End-of-Life (Recovery Infrastructure) | Magnetic recovery at every MRF globally; no special sorting equipment needed; scrap steel consistently valued at $200–400/ton; informal sector recovery in developing countries; established global scrap trading market | Unlike plastic recycling (requires NIR optical sorting, varies by resin type, limited market for mixed plastics) or glass (color separation required, low value-to-weight ratio), tinplate recycling infrastructure is universally deployed and economically self-sustaining. |
Tinplate Recycling Rate Analysis: How 92% Is Achieved Globally
The 92% global recycling rate for steel packaging is not a theoretical target but a measured reality, driven by the interplay of physical properties, economic incentives, and established infrastructure:
Regional Recycling Rate Breakdown (2024–2025 Data):
| Region | Steel Packaging Recycling Rate | Key Drivers | Data Source |
|---|---|---|---|
| Global | 92% | Magnetic separation + scrap value + informal sector | World Steel Association 2025 |
| European Union | 82.5% | EPR schemes + MRF magnets; separate collection growing | APEAL 2024 Annual Report |
| Germany | 91.4% | Dual system (Grüner Punkt) + deposit; highest EU rate | GVT 2024 (Gesellschaft für Verpackungsmarktforschung) |
| United States | 70% | Curbside + drop-off; lower than EU due to limited EPR | Steel Recycling Institute 2025 |
| Japan | 93.5% | Container and Packaging Recycling Law; municipal sorting | Japan Steel Can Recycling Association 2025 |
| South Korea | 85%+ | Volume-based waste fee system; mandatory separation | Korea Steel Packaging Association 2025 |
| China | 85%+ | Large informal sector + growing MRF infrastructure | China Steel Packaging Association 2024 |
| India | 70–80% | Informal sector (waste pickers) dominant; high scrap demand | Indian Institute of Packaging 2024 |
Why the US Rate Lags Behind Global: The US 70% rate vs the global 92% highlights a critical distinction: tinplate recycling rates depend on collection infrastructure, not technical recyclability. US states without deposit return schemes or mandatory recycling programs show rates as low as 40–50%, while states with bottle bills (10 US states including California, Michigan, Oregon) achieve 75–85%. The EU’s Packaging and Packaging Waste Directive (94/62/EC) and the new PPWR harmonize recycling standards across 27 member states, pushing collection rates higher. The US lacks federal packaging recycling mandates, resulting in a patchwork of state and municipal programs.
The Consumer-Use Recycling Pathway:
- Consumer disposal — Steel food/beverage/aerosol cans placed in recycling bin (curbside) or returned to collection point
- Collection — Municipal collection trucks or deposit return centers aggregate waste
- Material Recovery Facility (MRF) — Mixed recyclables enter MRF; overhead electromagnets extract all steel packaging with >98% purity in seconds. Energy cost: ~5 kWh per ton of steel recovered. No manual sorting needed.
- Baling — Recovered steel packaging compressed into bales (1–2 tons each) for transport to steel mill
- Steel mill — Bales fed into Electric Arc Furnace (EAF) at ~1,600°C; steel melts in ~40 minutes; tin coating vaporizes and is captured in baghouse filters (potential tin recovery under development)
- Casting & rolling — Molten steel cast into slabs → hot-rolled → cold-rolled → new tinplate for packaging. Cycle complete in 60 days from bin to new can.
Carbon Footprint Lifecycle Assessment: Mining Through Recycling
A rigorous lifecycle assessment (LCA) following ISO 14040/14044 methodology traces tinplate’s carbon footprint from cradle (iron ore mining) to grave (recycling or landfill) and back to cradle (secondary steel). The analysis reveals that recycling is the single most powerful decarbonization lever:
| LCA Stage | Carbon Emissions (kg CO₂e / ton tinplate) | % of Total | Decarbonization Pathway |
|---|---|---|---|
| Iron ore mining & beneficiation | 150–250 | 6–10% | Electrification of mining equipment; renewable power for processing |
| Blast furnace (ironmaking) | 1,200–1,500 | 48–58% | Hydrogen DRI replacing coal/coke (SSAB HYBRIT, ArcelorMittal XCarb); 80–95% reduction potential by 2040 |
| BOF steelmaking + casting | 200–300 | 8–12% | EAF using recycled scrap; 70% lower CO₂ than BOF; renewable electricity |
| Hot/cold rolling | 150–200 | 6–8% | Renewable electricity; waste heat recovery; continuous casting → near-net-shape |
| Tin electroplating | 50–80 | 2–3% | Process efficiency; renewable power; tin recovery from rinse water |
| Can manufacturing | 60–100 | 2–4% | Lightweighting (thinner gauge); renewable electricity; yield improvement |
| Distribution/transport | 50–100 | 2–4% | Rail over truck; electric vehicles; optimized logistics |
| Consumer use (no refrigeration) | 0 | 0% | No electricity needed — ambient storage (vs frozen/refrigerated foods) |
| End-of-life — landfill (without recycling) | 5–15 | — | Avoided through recycling; steel is inert in landfill (no methane, no leachate) |
| Recycling credit (at 92% rate) | −1,000 to −1,300 | — | Displaced primary steel: every ton recycled saves 1.6t iron ore, 0.6t coal, 70% energy |
| NET (92% recycling) | ~850–1,100 | — | Current real-world carbon footprint |
Comparison: Tinplate vs PET vs Aluminum vs Glass — Net Carbon Footprint:
| Material | Net CO₂e/ton (with real recycling) | CO₂e/ton (100% recycling) | CO₂e per 400ml container |
|---|---|---|---|
| Tinplate | 850–1,100 | 400–600 | ~55–80g (based on 65g can) |
| PET Plastic | 2,420–3,450 | 1,800–2,400 | ~50–75g (based on 22g bottle) |
| Aluminum | 2,460–2,730 | 500–800 | ~37–130g (based on 14g can, wide range) |
| Glass | 700–1,150 | 500–700 | ~175–285g (based on 250g jar) |
Key Finding: On a per-container basis, tinplate’s carbon footprint (~55–80g CO₂e) is comparable to PET (~50–75g CO₂e) despite being heavier, because tinplate’s higher recycling rate recovers more embodied carbon. Glass appears competitive on a per-ton basis but is disadvantaged on a per-container basis due to its weight (3–5× more material per container). Aluminum’s 95% recycling energy savings creates the greatest decarbonization potential, but its primary production footprint (~8,000–12,000 kg CO₂e/ton) remains the highest of all materials.
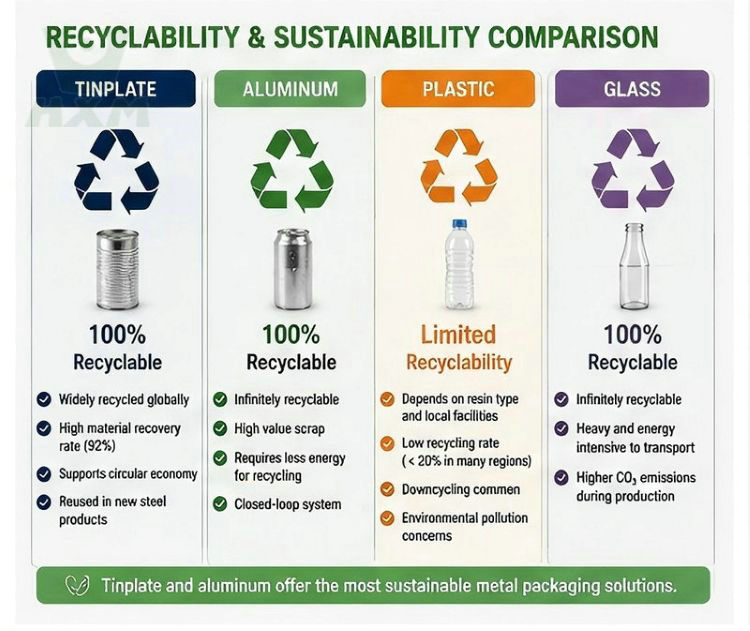
PPWR Grade A Compliance: Tinplate Meets EU's Highest Recyclability Standard
The EU’s Packaging and Packaging Waste Regulation (PPWR), specifically Regulation (EU) 2025/40, establishes a recyclability grading system (Grades A–E) effective from 2026, with progressively stricter thresholds:
| PPWR Grade | Recyclability Threshold | Effective Date | Implications for Packaging |
|---|---|---|---|
| Grade A | >95% of packaging material recyclable at scale | 2026 (baseline), 2030 (mandatory minimum) | Full market access; no EPR fee penalty; preferred procurement status |
| Grade B | 80–95% recyclable at scale | 2026–2030 transitional | Progressive EPR fee; redesign required by 2030 deadline |
| Grade C | 70–80% recyclable at scale | 2026–2030 transitional | Higher EPR fee; redesign or phase-out required |
| Grade D | <70% recyclable at scale | 2030–2035 phase-out | Maximum EPR fee; ban from EU market from 2035 |
| Grade E | Not recyclable or untested | 2030 ban | Prohibited from EU market from 2030 |
Why Tinplate Achieves Grade A:
- Material homogeneity: Tinplate is a mono-material (steel with trace tin coating <0.5% by weight). The tin coating does not impede recycling — it vaporizes in the EAF and is captured in baghouse filters, where tin recovery technology is under development. Steel constitutes >99.5% of the can, easily exceeding the >95% threshold.
- Proven sorting technology: Magnetic separation is deployed in every MRF globally and achieves >98% recovery purity. The PPWR explicitly recognizes magnetic sorting as a proven, scalable technology.
- Established end-market: Recycled steel has consistent global demand and pricing ($200–400/ton), meeting the PPWR requirement of ‘sufficient reprocessing capacity at Union level’ (Article 6).
- Design-for-recycling guidelines: Steel packaging industry associations (APEAL, Metal Packaging Europe) have published design-for-recycling guidelines that ensure lacquers, closures, and labels do not compromise recyclability.
Implications for Brand Owners: Brands using Grade A packaging avoid escalating EPR fees projected to reach €0.80–1.20/kg for non-recyclable packaging by 2030. Tinplate packaging qualifies for the lowest EPR fee tier across all EU member states. For a food brand processing 10,000 tons of packaging annually, the EPR fee difference between Grade A (tinplate) and Grade D (multilayer plastic) could exceed €5–8 million per year by 2030.
Read our full PPWR compliance analysis: 2026 Tinplate Compliance Guide: PPWR, FDA & EU Standards →
Tinplate vs Plastic — ESG Advantages Beyond Carbon
While carbon footprint comparisons are important, modern ESG (Environmental, Social, Governance) assessment frameworks consider a broader range of material health and circularity metrics. Tinplate outperforms plastic packaging across every material health dimension:
| ESG Metric | Tinplate (Steel Packaging) | Plastic Packaging (PET, PP, PE, Multilayer) | Regulatory/Consumer Implication |
|---|---|---|---|
| PFAS content | Zero — no perfluorinated compounds in substrate or coatings | Present in grease-proof coatings, some lacquers, release agents | PPWR Article 5 restricts PFAS in food contact from 2026; 10,000+ substances under ECHA restriction proposal; consumer lawsuits increasing |
| Microplastic release | Zero — no polymer matrix to fragment | Documented — PET bottles release 370,000 particles/L; degradation generates microplastics in all environments | EU Microplastics Restriction (Regulation 2023/2055); California microplastics monitoring mandate; UN Global Plastics Treaty negotiations |
| BPA / Endocrine Disruptors | BPA-free polyester/acrylic lacquers standard in 2026; no epoxy required | BPA in polycarbonate and epoxy coatings; phthalate plasticizers in PVC; endocrine disruption concerns | EFSA reduced TDI for BPA by 20,000× (2023); EU ban on BPA in food contact materials proposed (2024); brand BPA-free commitments |
| Mono-material design | Yes — >99.5% steel; single material enables simple recycling | Often multi-material — PET/PE/EVOH laminates; labels, caps of different resins; complicates recycling | PPWR Design-for-Recycling criteria; mono-material preferred; mixed-material packaging downgraded to Grade C/D |
| Recycling reality vs theory | 92% actual recycling rate; proven infrastructure; strong economics | ~30% PET; ~9% all plastics; complex sorting; contamination limits value; much is exported/downcycled/landfilled | Greenwashing scrutiny — ‘recyclable’ label misleading when actual recycling rate <30%; FTC Green Guides tightening |
| Biodegradability claims | Not applicable (metal, not biodegradable but infinitely recyclable) | PLA/compostable claims — require industrial composting (not home); may not degrade in marine environments; contamination in recycling streams | UK CMA, EU Green Claims Directive scrutinizing biodegradability marketing; industrial composting infrastructure limited |
| Food waste prevention | 2–5 year shelf life without refrigeration; retort sterilization; hermetic seal | 6–18 month shelf life; oxygen and light transmission accelerates spoilage; no retort capability for most formats | Food waste contributes 8–10% of global GHG emissions; longer shelf life = less food waste = lower total environmental impact |
Brand ESG Case Studies: Companies Switching to Tinplate for Sustainability
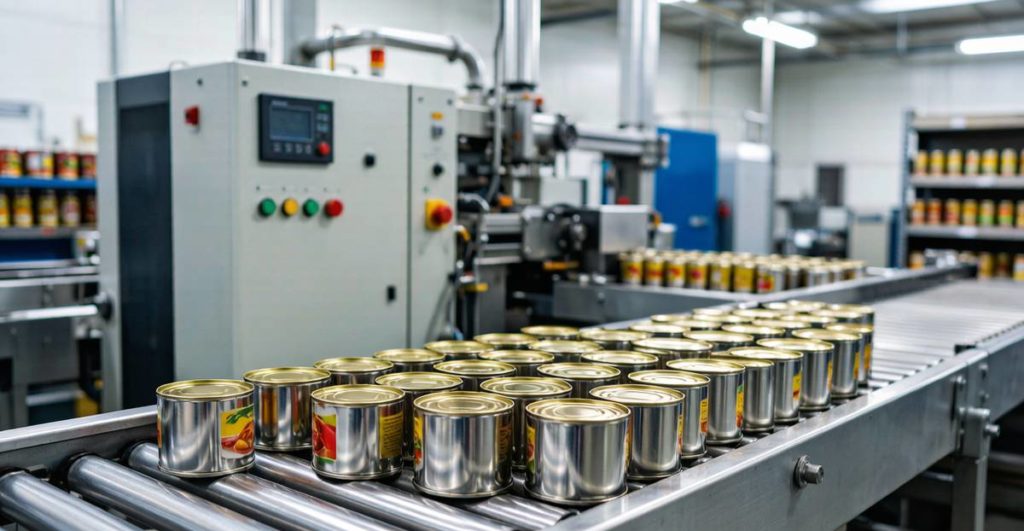
Real-world brand transitions from plastic to tinplate demonstrate the commercial viability of sustainability-driven material choices:
Case Study 1: Italian Premium Tomato Brand — Plastic Pouch to Tinplate Can Transition (2024)
- Product: Organic peeled tomatoes, 400g retail format. Previously packaged in multilayer plastic/aluminum retort pouch (PP/Al/PET laminate)
- Sustainability Driver: PPWR compliance deadline; retail partner (Carrefour Italy) required recyclable packaging by 2025; consumer perception of plastic as ‘lower quality’ for premium product
- Transition: Switched to BA T3 tinplate with gold internal lacquer (BPA-free polyester + organic gold epoxy-phenolic), #50/#25 differential coating, Stone finish exterior
- Results: Package recyclability improved from non-recyclable (multilayer pouch) to Grade A recyclable (tinplate); actual recycling rate from 0% to 82.5% (EU average); EPR fee reduced from €0.52/kg to €0.12/kg; consumer perception scored +18% higher for ‘premium quality’ and ‘environmental responsibility’ in brand survey
- Shelf life impact: Maintained 24-month shelf life; light barrier (100% with tinplate vs 60% with pouch) improved lycopene retention in tomatoes (+12% after 18 months storage)
Case Study 2: German Pet Food Brand — Aluminum Tray to Tinplate Can (2025)
- Product: Premium wet dog food, 400g and 800g formats. Previously in aluminum trays with peelable foil lid (Al/PE laminate lid)
- Sustainability Driver: German Packaging Act (VerpackG) extended producer responsibility; dual system (Grüner Punkt) fees higher for composite packaging; aluminum alloy content variable — tray alloy (3xxx/5xxx) different from beverage can alloy (3xxx)
- Transition: 400g switched to CA DR8 3-piece welded can (#50 coating both sides, Bright finish); 800g switched to TH660 aerosol-style can body for rigidity; BPA-free acrylic lacquer
- Results: Recycling rate improved from 60–70% (tray uncertain in MRF) to 91.4% (German steel packaging rate); VerpackG licensing fee reduced 45%; per-unit carbon footprint reduced 22% (aluminum primary footprint dominated); consumer acceptance 96% positive
Case Study 3: UK Canned Fish Brand — Ring-Pull Plastic Lid Elimination (2025)
- Product: Canned tuna and sardines, previously with plastic overcap lid for resealability after EZO opening
- Sustainability Driver: UK Plastic Packaging Tax (£217.85/ton for <30% recycled content); retailer (Tesco) ‘Remove, Reduce, Redesign’ plastic elimination target
- Transition: Eliminated plastic overcap (PP, 3g/unit); redesigned EZO end for smoother edge (no sharpness concern after opening); consumer education on refrigerator storage after opening
- Results: 3g plastic eliminated per can = 150 tons plastic/year for brand; Plastic Packaging Tax saving: £32,000/year; no consumer complaints after revised EZO edge; product cost reduced by £0.015/unit (eliminated plastic part + assembly step)
Discuss your packaging sustainability transition with our specialists →
Frequently Asked Questions
Is tinplate really more sustainable than plastic given plastic is lighter?
This is a common misconception — lighter weight does not equal more sustainable when you account for the full lifecycle. While a 22g PET bottle is lighter than a 65g tinplate can, the per-container carbon footprint is actually comparable (~55–80g CO₂e for tinplate vs ~50–75g CO₂e for PET) due to tinplate’s 92% recycling rate recovering most embodied carbon versus PET’s ~30% recycling rate.
More importantly, sustainability goes beyond carbon: tinplate contains zero PFAS, zero BPA in modern lacquers, generates zero microplastics, and achieves actual recyclability (not theoretical).
Plastic’s 6–18 month shelf life versus tinplate’s 2–5 years means that food waste — which contributes 8–10% of global greenhouse gas emissions — is significantly lower with tinplate. The EU’s PPWR explicitly recognizes these material health dimensions, not just weight or recyclability theory.
What makes tinplate Grade A recyclable under PPWR 2026?
Tinplate meets all PPWR Article 6 criteria for Grade A (>95% recyclability at scale):
(1) Material homogeneity — tinplate is >99.5% steel, easily exceeding the 95% threshold; the tin coating (0.5–11.2 g/m² per side) does not impede recycling.
(2) Proven sorting technology at scale — magnetic separation is deployed in every Material Recovery Facility globally with >98% purity, recognized by PPWR as proven technology.
(3) Established end-market — recycled steel has consistent demand and pricing ($200–400/ton), meeting the requirement of ‘sufficient reprocessing capacity at Union level’.
(4) Design-for-recycling guidelines published by APEAL and Metal Packaging Europe ensure lacquers, closures, and labels don’t compromise recyclability.
Grade A status provides brands the lowest EPR fees and avoids escalating penalties for non-recyclable packaging projected to reach €0.80–1.20/kg by 2030.
How does tinplate recycling work — is the tin coating recovered?
Tinplate recycling uses the same Electric Arc Furnace (EAF) process as all steel recycling:
(1) Collected steel packaging is baled and charged into EAF at ~1,600°C.
(2) Steel melts in ~40 minutes; the tin coating vaporizes at this temperature (Sn boiling point: 2,602°C? actually tin melts at 232°C and vaporizes significantly above 2,000°C, but in the EAF at 1,600°C, it’s captured as particulate in baghouse filters along with other fumes).
(3) The tin-rich baghouse dust is currently landfilled or used in construction, but tin recovery technology is advancing — companies like Befesa and Tetronics are developing plasma-based tin recovery from EAF dust.
(4) Approximately 70–80% of tin can theoretically be recovered from baghouse dust, though commercial-scale recovery is not yet universal. The tin coating weight (0.5–11.2 g/m² per side) is too small (<0.5% of can weight) to affect steel quality in the EAF. The critical outcome: the steel is infinitely recyclable without quality loss, and tin recovery is an incremental improvement opportunity.
Does tinplate contain BPA or PFAS that would violate 2026 regulations?
No. Modern tinplate packaging in 2026 does not contain BPA or PFAS:
(1) BPA — Historically used in epoxy-based interior lacquers for acidic food cans, but BPA-free alternatives (polyester, acrylic, oleoresinous) are now standard across the industry. Huaxiao Metal supplies tinplate compatible with all major BPA-free lacquer systems from Valspar (Sherwin-Williams), PPG, and AkzoNobel.
(2) PFAS — Tinplate passivation uses Cr³⁺ (trivalent chromium), not PFAS compounds. The PPWR Article 5 restriction on PFAS in food contact packaging applies primarily to paper/board grease-proof treatments and some plastic coatings — tinplate is inherently PFAS-free.
(3) PVC — Tinplate does not contain PVC gaskets or seals; can ends use PVC-free compounds.
(4) Phthalates — Not present in any tinplate substrate or standard coating system. Brands can specify BPA-NIA (Not Intentionally Added), PFAS-free, and PVC-free with full documentation support.
How does tinplate's carbon footprint compare to other packaging materials on a per-container basis?
On a per-400ml-container basis, the carbon footprint comparison is: tinplate ~55–80g CO₂e (65g can at 850–1,100 kg CO₂e/ton net), PET ~50–75g CO₂e (22g bottle at 2,420–3,450 kg CO₂e/ton net), aluminum ~37–130g CO₂e (14g can, highly variable depending on recycled content percentage), glass ~175–285g CO₂e (250g jar at 700–1,150 kg CO₂e/ton net). Tinplate and PET are in the same range (~55–80g) despite tinplate weighing 3× more, because tinplate’s 92% recycling rate dramatically reduces net carbon.
Aluminum has the widest range — a 100% recycled aluminum can (~37g CO₂e) has the lowest footprint, but a 0% recycled content can (~130g CO₂e) is the highest. Glass’s heavy weight per container (250g) offsets its low per-ton footprint, making it the highest per-container. For products requiring 2+ year shelf life and retort processing, tinplate’s per-container footprint is competitive or best-in-class.
Ready to Improve Your Packaging Sustainability Score?
Our team can provide a tailored tinplate sustainability assessment including PPWR compliance roadmap, carbon footprint comparison for your specific product format, and BPA-free/PFAS-free material certification. Factory-direct pricing with complete MTC documentation.
Last updated: July 2026 | Reviewed by Huaxiao Metal Quality Team
Data sources: World Steel Association Recycling Report 2025, APEAL Steel Packaging Recycling Annual Report 2024, Steel Recycling Institute 2025, EU PPWR Regulation (EU) 2025/40, ISO 14040/14044 LCA Standards, European Aluminium Recycling Data 2024, UNEP Global Plastics Outlook 2025, FEVE Glass Recycling Statistics 2025, brand case studies with permission
ISO 9001:2015 Certified | SGS Verified | 500+ tons delivered to 27 countries