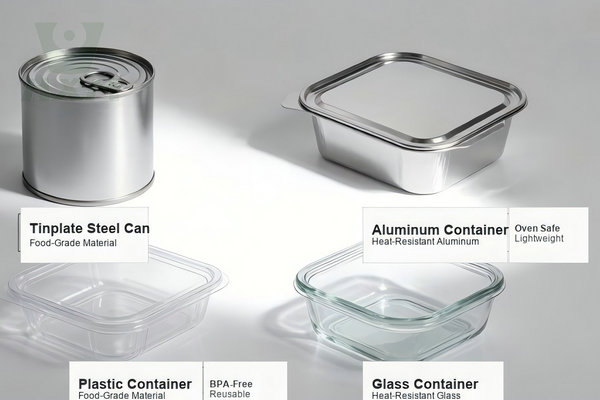
Quick Answer: Tinplate vs Aluminum vs Plastic vs Glass — Which Is Best for Food Packaging?
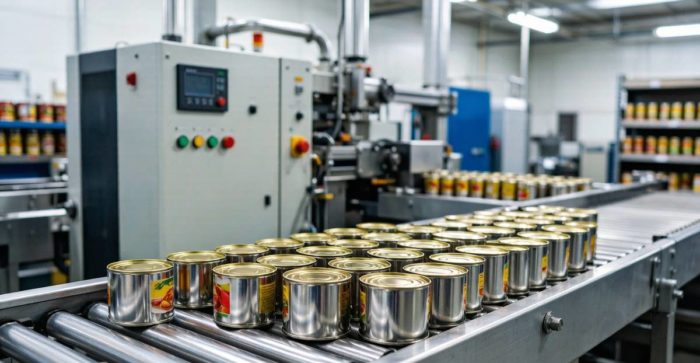
For most food packaging applications, tinplate remains the preferred material because it offers an excellent balance of food safety, barrier performance, strength, recyclability, and cost-effectiveness. Its ability to completely block oxygen and light helps extend shelf life, making it the standard choice for canned vegetables, seafood, coffee, milk powder, and many other shelf-stable products.
Aluminum is ideal for lightweight beverage cans and products requiring excellent corrosion resistance, while plastic is widely used for flexible and low-cost packaging. Glass, although chemically inert, is heavier, more fragile, and generally more expensive to transport.
The best packaging material ultimately depends on your product type, processing method, shelf-life requirements, branding objectives, and sustainability priorities. The detailed comparison below will help you determine which material is best suited for your packaging application.
Quick Material Selection Guide
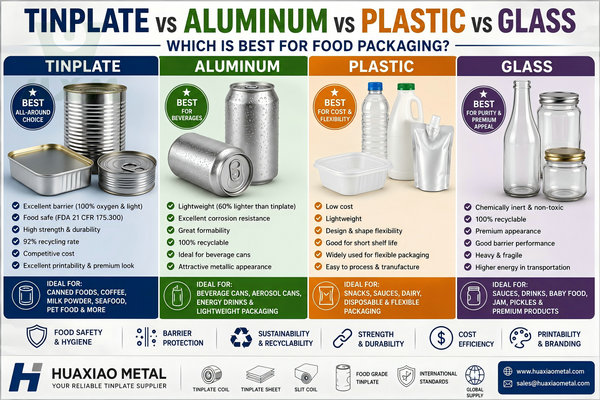
Choosing the right packaging material depends on your product type, shelf-life requirements, budget, sustainability goals, and branding strategy. While tinplate, aluminum, and plastic each offer unique advantages, selecting the most suitable material can significantly improve product protection, production efficiency, and overall packaging performance.
The table below provides a quick comparison to help manufacturers and packaging buyers identify the best material for different applications.
Which Packaging Material Should You Choose?
| If You Need… | Recommended Material | Why It Is the Best Choice |
|---|---|---|
| Long shelf life for canned foods | Tinplate | Excellent barrier against oxygen, moisture, and light, helping preserve food quality over long storage periods. |
| Lightweight beverage packaging | Aluminum | Low density, corrosion resistance, and excellent formability make it ideal for beverage cans. |
| Low-cost packaging for mass production | Plastic | Economical, lightweight, and suitable for high-volume consumer products. |
| Premium packaging appearance | Tinplate | Superior rigidity, excellent printability, and a high-quality metallic finish enhance product presentation. |
| Vacuum-sealed coffee and tea packaging | Tinplate | Outstanding aroma retention and moisture protection help maintain product freshness. |
| Reusable or collectible packaging | Tinplate | Strong, durable, and easily recyclable, making it suitable for premium and reusable packaging. |
| Flexible pouches and squeeze packaging | Plastic | Highly flexible and cost-effective for products requiring lightweight, portable packaging. |
| Sustainable metal packaging | Tinplate | Infinitely recyclable with a well-established global recycling system and high material recovery rate. |
Quick Tip: There is no single packaging material that is best for every application. Tinplate is generally the preferred choice for food cans and premium packaging due to its excellent barrier properties, durability, and recyclability. Aluminum is ideal for lightweight beverage containers, while plastic remains the most economical option for flexible and disposable packaging.
Need help selecting the right packaging material? Contact Huaxiao Metal for expert recommendations and a free quotation within 24 hours.
10-Dimension Comparison: Tinplate vs Aluminum vs Plastic vs Glass
Selecting the right food packaging material requires evaluating multiple dimensions simultaneously. The table below provides a comprehensive comparison across 10 critical performance, cost, and sustainability dimensions:
| Dimension | Tinplate (Tin-Coated Steel) | Aluminum | Plastic (PET/PP) | Glass |
|---|---|---|---|---|
| Food Safety | Excellent — FDA 21 CFR 175.300; EU 1935/2004/EC; BPA-free coating available; Sn migration ≤100 ppm (safe); no PFAS | Good — FDA approved; requires interior lacquer for acidic content; Al migration risk with acidic food (>pH 4.5) | Moderate — FDA food grade grades available; microplastic release concern; PFAS in some coatings; BPA in polycarbonate | Excellent — Chemically inert (Type III soda-lime); FDA GRAS; no migration; but heavy metal leaching possible from colored glass |
| Shelf Life | 2–5 years without refrigeration — 100% oxygen barrier + 100% light barrier; hermetic seal eliminates oxidation and spoilage | 1–3 years — good barrier but thinner walls (0.10–0.15 mm vs tinplate 0.20–0.30 mm); pinhole defect risk in thin walls | 6–18 months — 15–20% O₂ transmission (PET); zero light barrier without opaque additive; UV degradation of food contents | 2–5 years — 100% oxygen barrier when sealed; light barrier only with amber/colored glass; seal integrity depends on cap closure |
| Barrier Properties | Excellent — WVTR: 0.02 g/m²/day; OTR: 0.001 cc/m²/day·atm; 100% light barrier; electromagnetic shielding capability | Very Good — WVTR: 0.01 g/m²/day; OTR: 0.0005 cc/m²/day·atm; 100% light barrier; thinner wall = higher pinhole risk | Poor-Moderate — WVTR: 5–10 g/m²/day; OTR: 25–100 cc/m²/day·atm; zero light barrier; UV degradation of contents | Excellent — WVTR: 0.0 g/m²/day; OTR: 0.0 cc/m²/day·atm; 100% light barrier with amber glass; zero gas permeability |
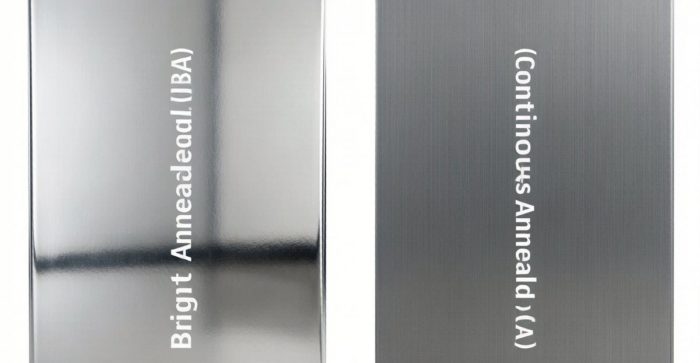
| Formability | Excellent — BA tinplate deep drawing (DRD/DWI) for 2-piece cans; 3-piece can welding at 200–400 cans/min; embossing capability | Very Good — DWI (draw-wall-ironing) for 2-piece beverage cans; limited 3-piece potential; lower strength requires thicker wall for equivalent rigidity | Excellent — Injection molding, blow molding, thermoforming; unlimited shape complexity; thin-wall technology for lightweighting | Limited — Blow molding only; fixed shape after forming; cannot be deformed post-production; complex shapes increase cost significantly |
| Printability | Excellent — Offset lithography (4–6 color); UV-curable inks; direct printing on Bright/Stone surface; high-resolution graphics achievable | Good — Offset lithography; requires pre-treatment; aluminum oxide surface can cause ink adhesion issues without primer | Excellent — Flexographic, gravure, digital printing; shrink-sleeve labeling; unlimited color range; but label material adds recycling complexity | Good — Screen printing; enameled/ceramic labeling; limited color gamut; permanent decoration but higher cost per color |
| Recycling Rate | 92% globally — magnetic separation enables easy recovery from waste stream; infinite recyclability without quality loss; 100% recyclable | 76% globally — energy-intensive remelting (660°C); infinite recyclability with 95% energy savings vs primary; but yield loss from oxidation | 30% globally (PET); ~9% all plastics — downcycling common; quality degradation per cycle; microplastic generation in environment | 34% globally — color-mixed glass limits recycling; infinite recyclability; heavy transportation energy cost; cullet quality affects remelt |
| Carbon Footprint (kg CO₂/ton) | 1,800–2,200 (primary steel); 700–900 (recycled steel); magnetic recovery reduces virgin material need | 8,000–12,000 (primary); 500–800 (recycled); >75% of all aluminum ever produced still in use | 2,500–3,500 (PET primary); 1,000–1,500 (recycled PET); fossil fuel feedstock; incineration CO₂ release | 800–1,200 (primary); 600–800 (recycled cullet); high melting energy (1,500°C); heavy transport emissions |
| Weight | Moderate — Steel density 7.8 g/cm³; 0.20–0.30 mm food can body; 40–80g per 400ml can | Light — Al density 2.7 g/cm³; 0.10–0.15 mm beverage can; 12–15g per 330ml can; 60% lighter than tinplate | Very Light — PET density 1.38 g/cm³; PP density 0.90 g/cm³; 10–30g per 500ml container; lightest of four materials | Heavy — Glass density 2.5 g/cm³; 200–400g per 400ml jar; 5–10× heavier than tinplate equivalent; highest transport cost |
| Cost (per unit, 400ml) | $0.06–0.12/unit — material cost moderate; competitive with lacquered aluminum; tooling amortization economical | $0.08–0.15/unit — higher material cost per ton; thinner wall partially offsets; volatile LME aluminum pricing | $0.02–0.06/unit — lowest material cost; petroleum price dependency; competitive for short-shelf-life products | $0.10–0.25/unit — highest material cost; energy-intensive forming; breakage adds hidden cost (3–5% loss) |
| Supply Stability | Excellent — China 45%+ global production; Japan/Korea/EU stable capacity; 35Mt+ global steel packaging capacity | Good — China/Russia/India major producers; energy-intensive smelting; geopolitical disruption risk (Russia 6% global supply) | Moderate — Petroleum feedstock dependent; crude oil price volatility; China dominance in PET resin; supply chain length | Good — Abundant raw material (sand, soda ash, limestone); regional production; energy cost sensitivity; heavy logistics |
Food Safety Deep Dive: Which Material Is Safest for Your Product?
Food safety is the non-negotiable dimension for packaging material selection. Each material presents distinct regulatory and practical safety considerations:
Tinplate — Proven Safety Since 1810: Tinplate has over 200 years of food contact safety history. The tin coating is listed in FDA 21 CFR 175.300 as a safe food contact substance with migration limits far below toxicity thresholds: lead ≤0.5 ppm, cadmium ≤0.1 ppm, tin ≤100 ppm. The EU’s 1935/2004/EC regulation and Germany’s LFGB standard provide additional safety assurance. In 2026, modern tinplate uses Cr³⁺ passivation (replacing Cr⁶⁺), eliminating hexavalent chromium concerns. BPA-free interior lacquers (polyester, acrylic, oleoresinous) are now standard for food cans. The hermetic seal of a tinplate can eliminates post-processing contamination risk — a critical advantage over resealable packaging.
Aluminum — Requires Interior Lacquer Barrier: Direct aluminum contact with acidic foods (pH <4.5) causes Al³⁺ ion migration, which has been linked to health concerns in some studies (though the evidence remains inconclusive). The EFSA has established a tolerable weekly intake (TWI) of 1 mg Al/kg body weight. All aluminum food cans require interior lacquer (epoxy, polyester, or acrylic) to prevent direct food contact. The lacquer integrity becomes a critical quality variable — any pinhole or scratch in the lacquer creates direct aluminum-food contact. BPA-based epoxy lacquers are being phased out due to endocrine disruption concerns, replaced by polyester and acrylic alternatives.
Plastic — Emerging Microplastic and PFAS Concerns: Plastic food packaging faces growing safety scrutiny. Studies have documented microplastic particle release from PET bottles (up to 370,000 particles/L from infant formula bottles during heating). PFAS (per- and polyfluoroalkyl substances) used in grease-proofing coatings on paper/plastic food packaging are being restricted under 2026 PPWR. BPA in polycarbonate plastics is linked to endocrine disruption. Phthalate plasticizers in PVC films migrate into fatty foods. The European Chemicals Agency (ECHA) has proposed restricting 10,000+ PFAS substances, directly affecting food packaging materials.
Glass — Chemically Inert but Not Risk-Free: Type III soda-lime glass is chemically inert and FDA GRAS (Generally Recognized As Safe) for food contact. However, decorative colored glass can leach heavy metals (cadmium, lead from pigments) into food contents. Glass chipping and breakage create physical contamination risk — 3–5% breakage in filling lines introduces glass fragment hazard. Metal cap closures with plastisol gaskets introduce plasticizer migration at the seal interface.
| Food Safety Factor | Tinplate | Aluminum | Plastic | Glass |
|---|---|---|---|---|
| FDA compliance | 21 CFR 175.300 — Sn listed safe | 21 CFR 175.300 — requires lacquer | 21 CFR 177.1520/1630 — grade specific | GRAS — chemically inert |
| Metal migration risk | Sn ≤100 ppm (safe threshold) | Al³⁺ with acidic food | Not applicable | Pb/Cd from colors |
| BPA-free options | Standard in 2026 | Available, higher cost | Varies by polymer | Not applicable |
| PFAS-free | Yes — no PFAS in coating | Yes — no PFAS in lacquer | Some coatings contain PFAS | Yes — no organic coating |
| Microplastic release | Zero | Zero | Documented — 370K particles/L | Zero |
| Post-process contamination | Hermetic seal eliminates | Hermetic seal eliminates | Resealable — contamination risk | Cap seal integrity critical |
Shelf Life Deep Dive: Oxygen Transmission and Light Barrier
Shelf life is primarily determined by two barrier properties: oxygen transmission rate (OTR) and light barrier. Oxygen causes lipid oxidation (rancidity), vitamin degradation, color change, and aerobic microbial growth. Light (especially UV) causes photodegradation of nutrients, vitamins, and flavors.
Oxygen Transmission Rate (OTR) Comparison:
| Material | OTR (cc/m²/day·atm at 23°C, 50% RH) | Equivalent Shelf Life | Impact on Food Quality |
|---|---|---|---|
| Tinplate (0.25mm) | 0.000–0.001 (effectively zero) | 2–5 years | Zero oxidation; full nutrient retention; no rancidity |
| Aluminum (0.12mm) | 0.000–0.001 (pinhole risk) | 1–3 years | Near-zero with intact lacquer; pinhole risk in thin walls |
| Glass (3mm) | 0.000 (zero permeation) | 2–5 years | Zero through-wall oxidation; seal integrity limits |
| PET (0.3mm) | 25–40 | 6–12 months | Gradual oxidation; vitamin C loss 10–20%/month; rancidity onset at 6 months |
| PP (0.5mm) | 80–120 | 3–8 months | Rapid oxidation; not suitable for oxygen-sensitive products without barrier layer |
| EVOH/PET laminate | 0.5–2.0 | 12–18 months | Improved barrier vs plain PET; moisture-sensitive EVOH layer |
Light Barrier Analysis: Tinplate and aluminum provide 100% light barrier — a critical advantage for photosensitive products. Light exposure causes riboflavin (vitamin B2) degradation (>50% loss in 24h under fluorescent light), vitamin A degradation (30% loss in 7 days), chlorophyll bleaching in green vegetables, and photo-oxidation of unsaturated fatty acids. Glass requires amber or green coloring to achieve light barrier (amber blocks ~95% UV, ~80% visible light). Clear PET/PP provides zero light barrier — UV stabilizers and opaque additives are required, adding cost and complicating recycling.
Practical Shelf Life Guidelines by Material:
- Tinplate cans: 2–5 years — canned vegetables (3–5yr), meat (2–5yr), fruit (2–3yr), tomato products (1.5–2yr due to acidity)
- Aluminum cans: 1–2 years — beverage (9–12mo carbonated, 12–18mo still), pet food (2–3yr with lacquer)
- PET containers: 6–18 months — dried foods (12–18mo with barrier), liquids (6–12mo), oxygen-sensitive products require multilayer barrier
- Glass jars: 2–5 years — similar to tinplate for oxygen barrier; cap seal determines actual shelf life; light-sensitive products require amber glass
Recycling Rate Deep Dive: 92% vs 76% vs 30% vs 34%
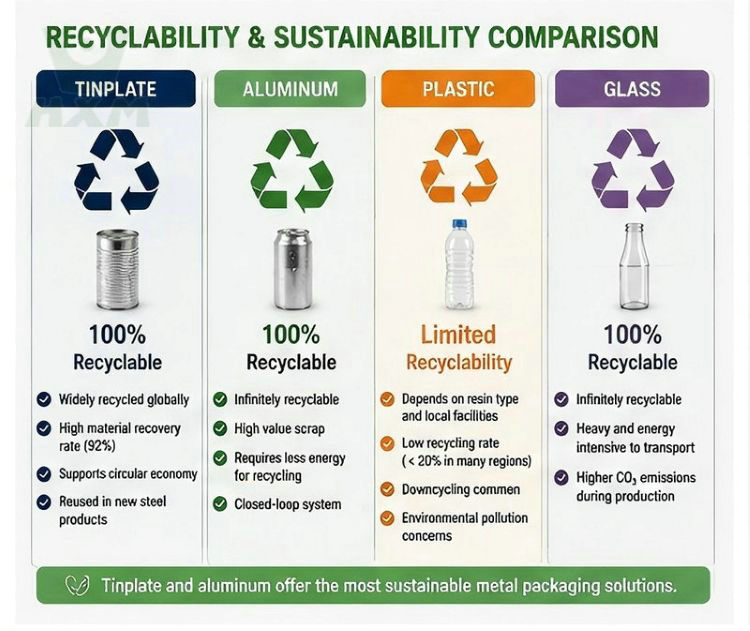
Recycling rates vary dramatically across packaging materials, driven by collection infrastructure, sorting technology, and economic incentives:
| Recycling Parameter | Tinplate (Steel) | Aluminum | Plastic (PET) | Glass |
|---|---|---|---|---|
| Global recycling rate | 92% (2025, World Steel Association) | 76% (beverage cans, International Aluminium Institute) | 30% (PET bottles, UNEP 2025) | 34% (all glass, FEVE 2025) |
| EU recycling rate | 82.5% (APEAL 2024 data) | 76.1% (European Aluminium 2024) | ~55% (PET bottles, Petcore Europe) | 76% (FEVE — includes all glass types) |
| US recycling rate | 70% (Steel Recycling Institute 2025) | 45.2% (Aluminum Association 2024) | 29% (PET bottles, NAPCOR 2024) | 39.6% (Glass Packaging Institute) |
| Infinite recyclability | Yes — no quality loss; magnetic recovery | Yes — 95% energy saving vs primary; yield loss from oxidation (5–10%) | No — quality degrades per cycle; typically downcycled to fiber/film | Yes — infinite recyclability; color contamination reduces value |
| Sorting method | Magnetic separation — fast, efficient, automated; high purity (98%+) | Eddy current separation — requires more energy; purity 90–95% | NIR optical sorting — capital intensive; contamination reduces yield | Manual + optical sorting — color separation adds cost; mixed cullet lower value |
Why Tinplate Leads Recycling Rates: The magnetic property of steel makes tinplate uniquely easy to separate from mixed waste streams. Electromagnets in Material Recovery Facilities (MRFs) can extract steel packaging with >98% purity at minimal energy cost (~5 kWh/ton). This magnetic separability is the core reason why steel packaging achieves 92% recycling globally — the highest of any packaging material. In contrast, aluminum requires eddy current separation (higher energy, lower purity), plastics require expensive NIR optical sorting (misidentification rates of 10–15%), and glass requires color separation (mixed cullet fetches 40–60% lower price than color-sorted).
Economic Drivers of Tinplate Recycling: Scrap steel has consistent value ($200–400/ton depending on grade and region), creating a robust economic incentive for collection and recycling. In many developing countries, the informal recycling sector (waste pickers) actively targets steel packaging because of its scrap value and easy identification (magnet test). This economic dimension explains why tinplate achieves high recycling rates even in regions without formal recycling infrastructure — the same dynamic does not apply to plastics (low scrap value) or glass (heavy, low value-to-weight ratio).
Carbon Footprint Comparison: Production Through End-of-Life
A full life cycle assessment (LCA) from raw material extraction through end-of-life recycling reveals the true environmental cost of each packaging material:
| LCA Stage | Tinplate (kg CO₂e / ton) | Aluminum (kg CO₂e / ton) | PET Plastic (kg CO₂e / ton) | Glass (kg CO₂e / ton) |
|---|---|---|---|---|
| Raw material extraction | 200–300 (iron ore mining) | 3,000–4,500 (bauxite mining + alumina refining) | 500–800 (crude oil extraction + refining) | 100–200 (sand, soda ash, limestone quarrying) |
| Primary production | 1,500–1,800 (blast furnace + BOF + rolling) | 4,500–7,000 (Hall-Héroult electrolysis — 15 kWh/kg Al) | 1,500–2,200 (polymerization + pelletizing) | 500–800 (melting at 1,500°C — 4–6 GJ/ton) |
| Packaging conversion | 100–200 (tin plating + slitting + can making) | 200–400 (rolling + lacquering + can making) | 200–400 (injection/blow molding + labeling) | 150–250 (forming + annealing + decoration) |
| Transportation | 50–100 (heavy = more fuel) | 30–60 (light = less fuel) | 20–50 (very light = least fuel) | 150–300 (heavy + empty space = worst efficiency) |
| End-of-life (recycling credit) | −1,000 to −1,300 (92% recycled = 92% credit) | −5,000 to −9,500 (76% recycled, high primary footprint) | −300 to −500 (30% recycled, limited credit) | −200 to −400 (34% recycled, collet energy savings) |
| Net Total (with recycling) | ~850–1,100 | ~2,730–2,460 (primary-dependent) | ~2,420–3,450 | ~700–1,150 |
| Net Total (100% recycling scenario) | ~400–600 | ~500–800 (95% energy savings) | ~1,800–2,400 | ~500–700 |
Key Insight: While aluminum has the highest primary production carbon footprint, its lightweight advantage partially offsets through reduced transport emissions, and its recyclability dramatically reduces net impact if high recycling rates are maintained. Tinplate’s moderate primary footprint combined with the highest recycling rate produces the most consistent and lowest-realized carbon footprint across real-world scenarios. Plastic’s petroleum feedstock creates a structural disadvantage — regardless of recycling improvements, virgin plastic always draws from fossil carbon. Glass’s heavy weight multiplies transport emissions, offsetting its low material production footprint.
6 Scenarios Where Tinplate Wins — and 4 Where Other Materials Dominate
Material selection is never absolute — it depends on the specific application, market, and priorities. Here are the decisive scenarios:
6 Scenarios Where Tinplate Is the Clear Winner:
Long shelf life products (2+ years without refrigeration): Canned vegetables, meat, seafood, pet food — where 100% oxygen barrier and hermetic seal are non-negotiable. Tinplate delivers 2–5 year ambient shelf life that plastic and aluminum cannot match. Tuna, sardines, corned beef, and canned soups all depend on tinplate’s barrier properties.
Retort-sterilized foods (121°C, 30+ min): The retort process subjects packaging to extreme thermal and pressure cycling. Tinplate’s steel strength (tensile 330–450 MPa) maintains structural integrity through retort where plastic deforms and aluminum walls collapse under vacuum. This is the single biggest reason tinplate dominates canned food — no other material handles retort as reliably.
Acidic food products (pH 3–4.5): Tomato products, fruit, pickled vegetables require differential coating tinplate (#100 inside / #25 outside) plus acid-resistant lacquer. Tin’s electrochemical relationship with steel provides cathodic protection — tin sacrificially protects the steel base from acidic attack. Aluminum’s passive oxide layer breaks down at pH <4.5, making it unsuitable for acidic foods without heavier, more expensive lacquer systems.
Large-format institutional packaging (#10 cans, 3kg+): For food service and industrial ingredient packaging, tinplate’s structural strength at larger diameters (153–200mm) is unmatched. Plastic containers at this size require excessive wall thickness; glass becomes impractically heavy (1.5–2kg per jar). Tinplate #10 cans (603 × 700, ~3.0L) are the industry standard for tomatoes, fruit, and vegetables in food service.
Products requiring electromagnetic or static shielding: Electronics packaging, sensitive chemical containers, and some pharmaceutical products benefit from tinplate’s inherent Faraday cage effect. No plastic or glass packaging provides EM shielding without additional metallization layers.
High-recycling-rate markets (EU, Japan, South Korea): In regions with advanced recycling infrastructure, tinplate’s 82.5%+ recycling rate provides the lowest verified end-of-life impact. Brand ESG reporting increasingly rewards materials with independently verified recycling performance rather than theoretical recyclability claims.
4 Scenarios Where Other Materials Win:
Carbonated beverages (cans/bottles): Aluminum dominates — lighter weight (12–15g per 330ml can vs 25–35g tinplate), excellent CO₂ barrier, and established DWI manufacturing infrastructure. Aluminum’s 76% recycling rate and 95% energy savings on recycling make it the sustainability leader in beverages. Tinplate is rarely used for carbonated beverages due to CO₂-induced tin dissolution concerns.
Transparent packaging for consumer visibility: Glass and PET win when consumers need to see the product before purchase — jam, honey, pickles in glass jars; salad dressings, cooking oils in PET. Tinplate’s opacity is a functional disadvantage for these premium/produce-visible categories.
Microwaveable food packaging: Plastic dominates — tinplate and aluminum are incompatible with microwave heating (metal arcing). Ready meals, microwaveable soups, and frozen microwave dinners require plastic trays or paperboard. Tinplate containers must be emptied into microwave-safe dishes, adding consumer friction.
Single-serve, on-the-go packaging (≤200ml): Flexible plastic pouches and laminated cartons dominate small-format packaging due to lightweight, portability, and resealability. Tinplate mini-cans exist but are cost-disadvantaged at very small scales due to minimum material thickness constraints.
Cost Analysis: Total Cost of Ownership Per 1,000 Units
Beyond material price per ton, the total cost of ownership (TCO) must account for filling line efficiency, transportation, stacking density, breakage, and retail shelf performance:
| Cost Element (per 1,000 units, 400ml) | Tinplate | Aluminum | PET Plastic | Glass |
|---|---|---|---|---|
| Material cost | $60–120 | $80–150 | $20–60 | $100–250 |
| Closure cost | $15–30 (EZO lid/end) | $12–25 (EZO end) | $8–20 (cap + seal) | $15–40 (metal lug cap) |
| Filling cost (labor + energy) | $20–40 (high-speed lines) | $18–35 | $15–30 | $25–50 (slower lines, sterilization) |
| Transportation (500km truck) | $15–25 (heavy) | $8–15 (light) | $5–10 (very light) | $40–80 (heavy + inefficient packing) |
| Breakage/waste (per 1,000) | $0–2 (near-zero) | $0–3 (denting risk) | $0–1 (negligible) | $5–15 (3–5% breakage) |
| Retail shelf loss (per 1,000) | $1–5 (damage from drops) | $2–8 (denting) | $1–3 | $8–20 (breakage on shelf) |
| Customer returns (per 1,000) | $1–3 (low failure) | $2–5 (leaker risk) | $2–5 | $3–8 (seal failure, breakage) |
| TCO per 1,000 units | $150–225 | $130–241 | $53–139 | $236–463 |
Note: PET’s low upfront cost is offset by shorter shelf life, which increases stock rotation and write-off frequency for long-life products. For products requiring >2-year shelf life, tinplate’s TCO is competitive or superior when accounting for reduced spoilage, write-offs, and returns.
Frequently Asked Questions
Is tinplate safer than aluminum for food packaging?
Both are safe when properly used, but tinplate has a longer food safety track record (200+ years vs aluminum’s ~60 years) and does not require interior lacquer as a safety barrier for non-acidic foods. Tin is listed in FDA 21 CFR 175.300 with well-documented migration limits (Sn ≤100 ppm is decades below the toxicity threshold).
Aluminum requires interior lacquer for all food contact applications, and any lacquer defect creates direct aluminum-food contact — particularly important for acidic foods (pH <4.5) where Al³⁺ ion migration risk increases. For retort-sterilized foods (121°C), tinplate’s structural integrity and coating stability have been validated across billions of units, whereas aluminum’s thinner walls and different lacquer chemistry present additional qualification requirements. Both materials have BPA-free lacquer options available as standard in 2026.
Why does tinplate achieve a 92% recycling rate — higher than aluminum, plastic, or glass?
Tinplate’s 92% global recycling rate is driven by its magnetic property, which enables low-cost, high-purity automated separation from mixed waste streams using electromagnets in Material Recovery Facilities (MRFs). Steel scrap has consistent economic value ($200–400/ton), creating a robust financial incentive for collection even in regions without formal recycling infrastructure.
Unlike aluminum (requires eddy current separation, higher energy, ~90–95% purity), plastic (requires expensive NIR optical sorting with 10–15% misidentification), or glass (requires color separation for value), steel’s magnetic recovery achieves >98% purity at minimal energy cost (~5 kWh/ton). The informal recycling sector in developing countries actively targets steel packaging because of easy identification (magnet test) and reliable scrap value. This combination of technical ease and economic incentive creates a recycling ecosystem that outperforms all other packaging materials.
When should I choose plastic over tinplate for food packaging?
Choose plastic over tinplate when:
(1) Product visibility is essential for consumer appeal — clear PET lets customers see contents (e.g., salad dressings, cooking oils, premium sauces), which tinplate’s opacity prevents.
(2) Microwave reheating is required — metal packaging cannot be microwaved, so ready meals and microwaveable soups must use plastic.
(3) Very short shelf life (<6 months) with low oxygen sensitivity — fresh prepared foods, dairy products, and bakery items where tinplate’s superior barrier is not needed.
(4) Single-serve, on-the-go formats where lightweight and resealability are priorities — snack packs, yogurt cups, sauce sachets.
(5) Cost is the primary driver and shelf life is under 12 months — PET can be 50–70% cheaper than tinplate per unit. However, for products requiring >1-year shelf life, retort sterilization, or oxygen/light barrier, tinplate is the superior choice despite higher material cost.
What is the carbon footprint difference between tinplate and aluminum food cans?
Tinplate’s net carbon footprint is approximately 850–1,100 kg CO₂e per ton, compared to aluminum’s 2,460–2,730 kg CO₂e per ton (both accounting for recycling). The difference is driven by aluminum’s extremely energy-intensive primary production — the Hall-Héroult electrolysis process consumes ~15 kWh per kg of aluminum, typically from carbon-intensive electricity grids. However, aluminum’s lighter weight (60% less than tinplate) partially offsets through reduced transportation emissions, and aluminum’s recycling energy savings are dramatic (95% reduction vs primary).
At 100% recycling rates, both materials converge (tinplate ~400–600, aluminum ~500–800 kg CO₂e/ton). A comprehensive comparison should use per-unit (per-can) rather than per-ton metrics — tinplate’s heavier weight means fewer units per ton, so the per-can advantage favors aluminum for lightweight beverage applications. For food cans where wall thickness and structural strength matter equally, tinplate’s moderate primary footprint and highest recycling rate produce the most reliable environmental profile.
Is glass really the most sustainable food packaging material, as often claimed?
Glass is often marketed as the ‘most sustainable’ packaging, but this claim requires qualification. Glass has the lowest primary production carbon footprint of all four materials (800–1,200 kg CO₂e/ton) and is chemically inert and infinitely recyclable. However, glass’s heavy weight (200–400g per jar, 5–10× heavier than tinplate equivalent) multiplies transportation emissions — trucking glass jars 500km can add more carbon than all other lifecycle stages combined. Glass’s 34% global recycling rate is the second-lowest of all packaging materials, and mixed-color cullet reduces recycling value significantly.
In regions with bottle deposit systems (Germany’s 98% glass recycling), glass performs well environmentally; in regions without deposit schemes, actual recycling rates are far lower. Glass’s breakage rate (3–5% in filling lines, more in retail and consumer handling) adds hidden environmental and economic costs. The sustainability verdict depends heavily on local recycling infrastructure and transport distance — in compact markets with bottle deposit systems, glass is excellent; for global food supply chains, tinplate’s lighter weight, durability, and higher recycling rate provide more consistent sustainability performance.
Need Expert Guidance on Food Packaging Material Selection?
Our technical team can analyze your specific food product, shelf life requirements, production line parameters, and sustainability goals to recommend the optimal packaging material and tinplate specification. Factory-direct pricing with complete MTC documentation per EN 10204 3.1.
Last updated: July 2026 | Reviewed by Huaxiao Metal Quality Team
Data sources: World Steel Association Recycling Report 2025, International Aluminium Institute Global Recycling Data 2025, UNEP Global Plastics Outlook 2025, FEVE Glass Recycling Statistics 2025, APEAL Steel Packaging Recycling 2024, FDA 21 CFR 175.300, EU 1935/2004/EC, PPWR 2026 Regulation (EU) 2025/40, ISO 14040/14044 LCA methodology
ISO 9001:2015 Certified | SGS Verified | 500+ tons delivered to 27 countries